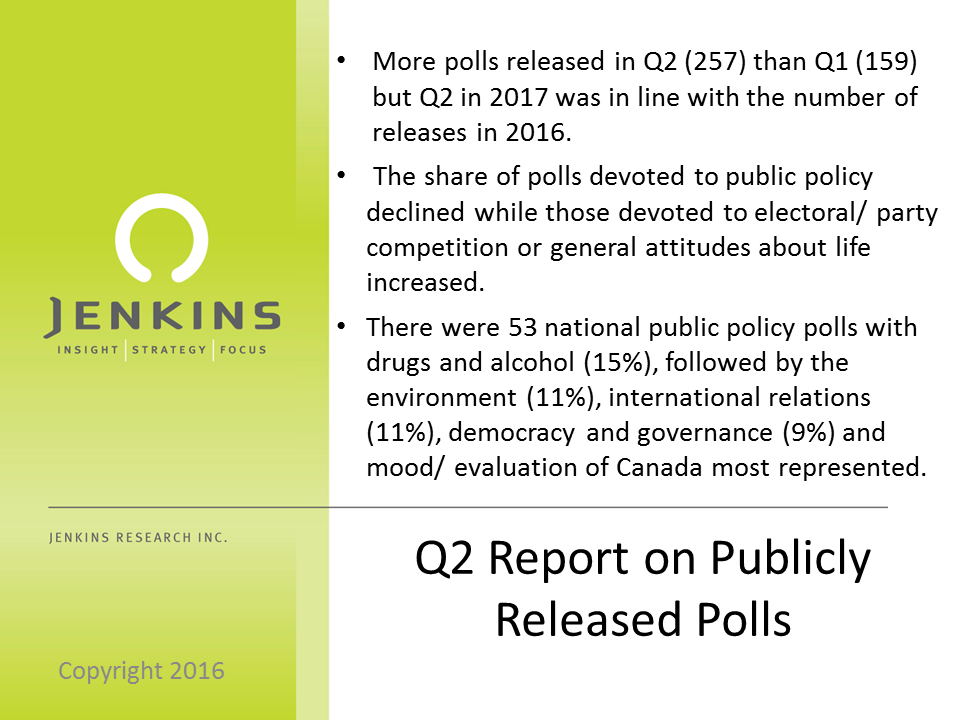
[row width=”boxed” background=”none” solid_color_value=”#FFFFFF” solid_color_color=”#ffffff” gradient_color=”0% #FFFFFF,100% #000000″ gradient_direction=”vertical” repeat=”full” img_repeat=”full” autoplay=”yes” position=”center center” paralax=”no” border_width_value_=”0″ border_style=”solid” border_color=”#000″ div_padding_top=”0″ div_padding_bottom=”0″ div_padding_right=”0″ div_padding_left=”0″ ][column span=”span12″ hidden_on=””][text el_title=”Discussion” text_margin_top=”0″ text_margin_bottom=”0″ enable_dropcap=”no” animation_type=”0″ disabled_el=”no” ]Q2 saw a rise from Q1 in the number of polls released into the public domain as 173 unique surveys produced 257 different releases compared with 195 in Q1. Overall, however, the number of polls is consistent with Q2 of 2016.
More than half of these were national polls with provincial and local polls representing the rest.
Nationally, there were 1.57 national polls released each day in Q2 with a policy related or economic issue polls at .75 per day and a electoral/ horserace poll at .32 per day.
The sheer volume of polls released each quarter means there is a lot of competition to get “eyes” on any one particular release.[/text][imageframe el_title=”Overview of opinion polls released in Canada” image=”https://jenkinsresearch.ca/wp-content/uploads/2017/07/2017Q2-Public-Poll-Trend-Year-over-year.png” image_size=”large” style_type=”none” bordersize=”1px” align=”left” lightbox=”no” animation_type=”0″ disabled_el=”no” ][/imageframe][text el_title=”Continued” text_margin_top=”0″ text_margin_bottom=”0″ enable_dropcap=”no” animation_type=”0″ disabled_el=”no” ]Elections in several provinces in Q2 contributed to a rise in the share of releases that were primarily about electoral/ party competition issues, especially when we consider all releases. The share of releases associated with perceptions of life and world we live in also increased at the expense of public policy questions.
In fact, 51% of all non-national releases were about the political competition (though there may be some issue content here) in that geography. Only 20% of national releases are about electoral competition. The difference reflects the fact that there are so many potential political/ party races at a sub-national level and these competitions are being monitored and reported on.
Public policy remained a major area of polling with 93 releases (53 national). The top categories for national policy releases were issues of drugs and alcohol (15%), followed by the environment (11%), international relations (11%), democracy and governance (9%) and mood/ evaluation of Canada.
The government announcement on marijuana legalization clearly motivated national policy polling and our national birthday contributed to a number of polls reflecting on Canada.
Many policy issues were also addressed in the electoral and political competition polls but in our judgment, the polls in this category were primarily about the horserace even if they contain some policy content.[/text][imageframe el_title=”Q1/Q2 comparison” image=”https://jenkinsresearch.ca/wp-content/uploads/2017/07/2017-Public-Poll-Categories.png” image_size=”large” style_type=”none” bordersize=”1px” align=”left” lightbox=”no” animation_type=”0″ disabled_el=”no” ][/imageframe][text el_title=”Final” text_margin_top=”0″ text_margin_bottom=”0″ enable_dropcap=”no” animation_type=”0″ disabled_el=”no” ]
Data reported here is property of Jenkins Research Inc. Data is reported based on surveys identified and coded at the time of writing. As other survey releases are found, the underlying data is updated. The PowerBI dashboard has the most current information.
Interactive Dashboard (PowerBI) is included below.
[/text][/column][/row][row width=”boxed” background=”none” solid_color_value=”#FFFFFF” solid_color_color=”#ffffff” gradient_color=”0% #FFFFFF,100% #000000″ gradient_direction=”vertical” repeat=”full” img_repeat=”full” autoplay=”yes” position=”center center” paralax=”no” border_width_value_=”0″ border_style=”solid” border_color=”#000″ div_padding_top=”0″ div_padding_bottom=”0″ div_padding_right=”0″ div_padding_left=”0″ ][column span=”span12″ hidden_on=””][fullwidth el_title=”Q2 Interactive Report” menu_anchor=”PowerBI Report” backgroundrepeat=”no-repeat” backgroundposition=”left top” backgroundattachment=”scroll” bordersize=”0px” borderstyle=”Solid” paddingtop=”20px” paddingbottom=”20px” paddingleft=”20px” paddingright=”20px” disabled_el=”no” div_margin_top=”0″ div_margin_left=”0″ div_margin_bottom=”0″ div_margin_right=”0″ ][/fullwidth][/column][/row]

