Sometimes I think a demographic analysis is the bane of my existence. Endless bivariate comparisons of various independent variables against the questions asked in the survey. Tedious, often of tenuous value, and, of course, subject to problems of collinearity.
Demographic characteristics are not independent of each other. Saying that older people are more likely is a half truth.
Age, for example, is not independent of many other variables. The educational attainment of those older will be less than for those who are younger because after WWII, post-secondary education became more available. So education is very generational dependent. This, of course, is just one example of a broad problem of looking at a single variable in isolation.
Individuals are better thought of in terms of their life context, which is the intersection of their age, gender, working status, educational attainment (to this point), and household income (perhaps even other things), rather than in terms of their position on any single one of these. A person with low income may have different attitudes and values if he or she is a student versus an unemployed blue collar worker, versus a senior living on a fixed income.
Can we represent where a person is in their life in terms of a few demos?
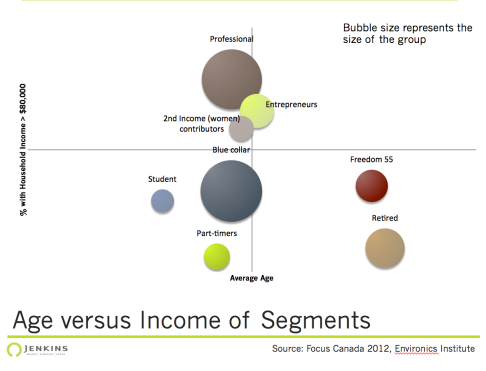
Using the 2012 Focus Canada dataset from the Environics Institute, we created 8 lifestage groups with a basic cluster analysis. Although occupational status is a major driver, which is often not one of the most reported on demographic variables, age, income and education serve to further divide the population. In fact, the two largest groups, Professionals and Blue Collar represent 57% of the population.
The 8 groups represent fairly well recognizable segments of the population. In one variable, we can effectively combine the effects of multiple demographic variables. Small niche groups are harder to represent but the broad groups are evident and one could still sub-divide the large groups to look at age within them.
The value of the model, however, is not in being able to create the groups but in being able to offer insights into public attitudes.
Using two questions that tap attitudes about the economy — specifically whether people are better off compared with the previous generation and whether the next generation will be better off then themselves we can see the potential of this approach. The ideal that each new generation would be better off than the previous is not universally believed. Just 52% believe they are better off than the previous generation and only 25% think the future is brighter for the next generation.
Looking at it in terms of the segments is interesting because…
- the two retired groups have a similar perspective despite their education and income differences. This is a true age/ generational effect.
- Professionals and Blue collar groups differ fundamentally. Blue collar workers are more likely to see the erosion in the dream of being better off then the previous generation. Is this a key insight into the challenge of the economy and the differential rewards it offers?
 Income, education, age and working status are all related to attitudes but none really captures the dynamic evident here because they miss a key tension.
More work is clearly needed and while the question maybe particularly suited to a lifestage approach to the analysis most attitudes are constructed based on a life experience.
Demographic analyses are a staple and tend to be done using a series of bivariate analyses primarily because this is what our table systems spit out. So the next time you see or undertake a demographic analysis ask yourself, is this the best we can do?
More information on the lifestage groups will be available in a longer format shortly.
